
Data is everywhere! Nowadays, we rely more on data. We share, collect and analyze the data for better digital solutions for business. To visualize and study data, there is a variety of data representations and visualization. Don’t panic, if you don’t know them and are not good at Mathematics. Here comes a tech savior - react charting libraries.
In this blog, I have provided a list of a few best and most popular charting libraries. Read till the end to get your perfect solution solver for data visualization with React.##
1. Recharts
This is the most popular library with 19.5k GitHub stars and 4.6M downloads per month. The best part is this is a composable library that allows you to import only the necessary components to build the product.
It has a Large community of 224 contributors and a group of maintainers -https://github.com/recharts.
The repository is there with more frequent bug fixes and new releases are expected on the GitHub group.
The chart types you get:
- Area Chart
- Bar Chart
- Composed Chart
- Pie Chart
- Radar Chart
- Radial Bar Chart
- Scatter Chart
- Funnel Chart
- Treemap
- Sankey Chart
Features of recharts library:
-
Composable - components can be reusable and can be structured as per the requirements and suits
-
Declarative - we can declare how you want components instead of following rules
-
Customizable - customize the components from this library to suit your data visualization needs.
-
Responsive - can be accessed on small to big devices
-
Built on top of SVG elements
-
Lightweight dependency on D3
2. react-chartJs-2

The top choice for react charting libraries as it is the best Javascript chart library.
It is the favorite library among developers with 5.5k stars on GitHub and 3.1M downloads per month. With Chart.js, you can easily generate various charts, such as line, bar, pie, and radar charts.
The library offers extensive customization options for colors, labels, tooltips, and animations. Not to worry about its stable version as it is one of the most well-maintained libraries.
The chart types you get:
- Chart
- Bar
- Line
- Pie
- Doughnut
- PolarArea
- Radar
- Scatter
- Bubble
Features of react-chartjs-2 library:
-
Open source community which is active
-
Declarative - we can declare how you want components instead of following rules
-
Compatible modern browsers
-
Responsive on all devices
-
Customizable chart types
3. Victory

The victory is a popular JS library built by Formidable. Formidable has well-known clients like - Microsoft, Google, and Starbucks. They have very beautiful and unique chart designs.
You can check their gallery - Victory Chart gallery.
It also has a set of react native charting components called Victory Native. The library has advanced features such as tooltips, animations, and responsive layouts.
The chart types you get:
- VictoryBoxPlot
- VictoryArea
- VictoryAxis
- VictoryBar
- VictoryCandlestick
- VictoryChart
- VictoryErrorBar
- VictoryGroup
- VictoryLine
- VictoryPie
- VictoryPolarAxis
- VictoryScatter
- VictoryStack
- VictoryVoronoi
- VictoryHistogram
Features of victory library:
-
Easy to understand API and quick to implement
-
Flexible components
-
Robust
-
Reusable data visualization
-
Supports multiple chart types.
4. Nivo
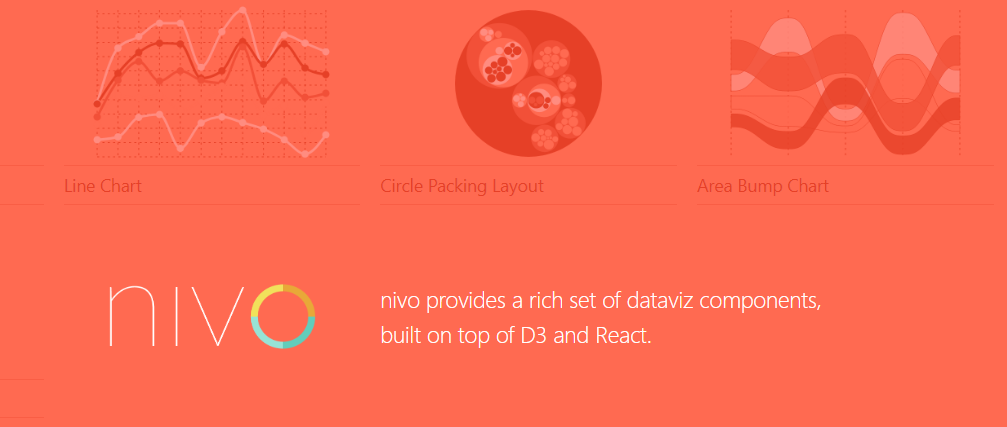
This library is built with reactJs and D3. It offers HTML, SVG charts and canvas also it works well with animations.
It provides support for client and server-side rendering. Nivo has beautiful charts that can be customized with less effort. You don’t need to worry about it’s view on different screens as it provides responsive charts that fill across all screen sizes. The library is popular with 11K GitHub stars and 336K+ npm downloads.
To use this library, you will get detailed documentation to help you get started.
The chart types you get:
- AreaBump
- Bar
- CirclePacking
- Bump
- Bullet
- Calendar
- Chord
- Funnel
- GeoMap
- HeatMap
- Line
- Marimekko
- Network
- ParallelCoordinates
- Pie
- Radar
- RadialBar
- Sankey
- Stream
- Sunburst
- SwarmPlot
- TimeRange
- TreeMap
Features of victory library:
-
Highly customizable with patterns, gradients and theming.
-
It has the motion/transitions powered by react-spring
-
Interactive component playground.
-
Server Side Rendering and HTTP API
5. React Vis
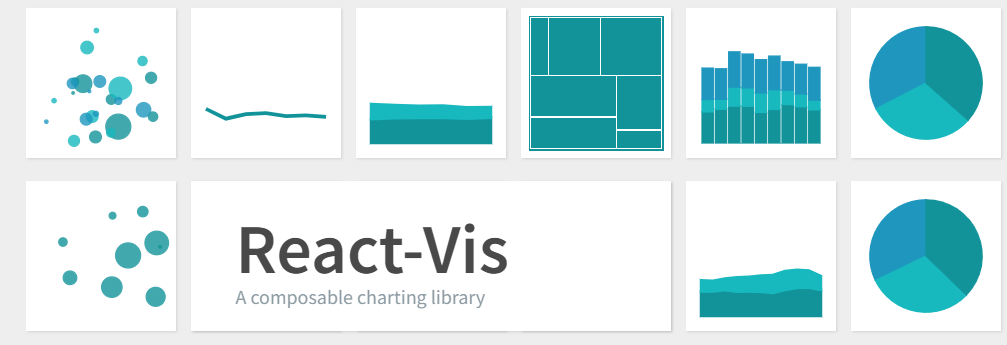
This library is created by Uber and built with React and D3. It is very similar to visx and the easiest charting library to get started with for beginners. It functions very similar way with props, children and callback. React-vis provides attractive, customizable charts out of the box and supports animated charts powered by React Motion.
It is officially deprecated but the community is still active with the latest pull merged on November 9, 2022. Even after this, the library is popular with 8.4k GitHub stars and 436k downloads per month.
The chart types you get:
- Scales and Data
- Animations
- CirclePacking
- XYPlot
- RadialChart
- Treemap
- Sankey
- Radar Chart
- Parallel Coordinates
- Sunbursts
- Legends
Features of react-vis library:
-
Supports SVG and canvas
-
Simple to use - Without prior knowledge of the react-vis library, you can get started with it very easily
-
Integration with React - React-vis doesn't add extra nodes and supports the React lifecycle.
-
The library has a set of defaults that the specific user's preferences can customise.
6. Visx
Visx is not a technically charting library it considers itself as 'a collection of expressive, low-level visualization primitives for React'.
It is beautifully designed by Airbnb with the most unique and modern data viz components. The library is popular with 16.2k GitHub stars and 1.1M downloads per month.
The chart types you get:
- Annotation
- Curve
- Chord
- Bars
- Axis
- Trees and many more
Features of Visx library:
-
Visx split into multiple packages. You can use what you need
-
Your React app already has an opinion on how animation, theming, and styling should be done. Visx avoids adding another and integrates with all of them. and hence you can bring your own CSS-in-JS, animation library, or state management system.
7. BizCharts

BizCharts is based on G2 and react for data visualization. Alibaba built this library for most of its platform use. It is known for a very conventional, highly customizable and easy to use.
Check the repo - BizCharts
Features of Visx library:
-
Easy to use - As it is based on react, it is very easy if you already work on react. You don't need to have data visualization knowledge
-
Strong expansion abilities - components are flexible and can used as per convenience in different cases
-
React ES6 grammar - BizCharts is based on the latest JavaScript standard, ES6.
-
Variety of visualization charts - from graphs and lines to pie charts
Conclusion
We have plenty of the best charting libraries for React. The choice of library depends upon requirements and preferences. We may use more than one library in your React application. Happy exploring!! Happy charting with React!!


